Although Bright View has extensive capabilities when it comes to visualizing monitoring information, it may be desirable to be able to visualize monitoring data using Grafana (e.g. when Grafana is used as a datacenter wide monitoring tool). As of Bright 8.2 it is possible to follow the instructions below to add your Bright cluster as a Prometheus data source in Grafana.
Optional: Setting up Grafana
If you have not set up Grafana yet, this GitHub repository contains a script that lets you deploy it quickly:
git clone https://github.com/Bright-Computing/bright-grafana.git
cd bright-grafana
./install-grafana.sh
systemctl enable grafana-server.service
systemctl start grafana-server.service
At this point you should have a working Grafana deployment on port 3000 of the server that you installed on. You can verify this by pointing your web-browser to http://yourserver:3000. If this does not work, please check firewall / packet filtering settings. The default login for Grafana is admin with password admin.
Authentication
In order to pull metrics from a Bright cluster, Grafana will have to authenticate to Bright’s cluster management daemon. The safest way of doing is to use certificate based authentication. We will first create a management profile that provides access to just the right cluster management API calls that are necessary for Grafana to retrieve monitoring data. Then we will issue a certificate with this profile and we use this to let Grafana authenticate to the Bright cluster management API.
Defining the profile:
root@mdv-test:~# cmsh
[mdv-test]% profile
[mdv-test->profile]% add grafana
[mdv-test->profile*[grafana*]]% set services cmmon
[mdv-test->profile*[grafana*]]% set tokens private_monitoring_token plot_token get_labeled_entity_token
[mdv-test->profile*[grafana*]]% commit
[mdv-test->profile[grafana]]% quit
Creating the certificate:
root@mdv-test:~# cmsh
[mdv-test]% cert
[mdv-test->cert]% createcertificate
Name:           createcertificate - Create a new certificate
Usage:           createcertificate <key-length> <common-name> <organization> <organizational-unit> <locality> <state> <country> <profile> <sys-login> <days> <key-file> <cert-file>
Arguments:
          key-file                 Path to key file that will be generated
          cert-file                Path to pem file that will be generated

[mdv-test->cert]% createcertificate 2048 "Grafana" "Bright Computing" "Engineering" "Amsterdam" "NH" "NL" grafana nobody 3650 /root/grafana.key /root/grafana.pem

Tue Jan 12 21:58:52 2021 [notice] mdv-test: New certificate request with ID: 2
Certificate key written to file: /root/grafana.key Certificate pem written to file: /root/grafana.pem
We now have a key in /root/grafana.key, a certificate in /root/grafana.pem which we will need in the next step as we configure Grafana. We will also need the CA certificate, which can be found in /cm/local/apps/cmd/etc/cacert.pem. Note that you will actually find two certificates in the cacert.pem. You will need to use both as the CA cert value in the next step.
Adding your Bright cluster as a Grafana data source
To add a Bright cluster as a data source to Grafana, select Configuration and then Data Sources:

Then, press Add data source, select the Prometheus option and fill out the first part of the form as follows:
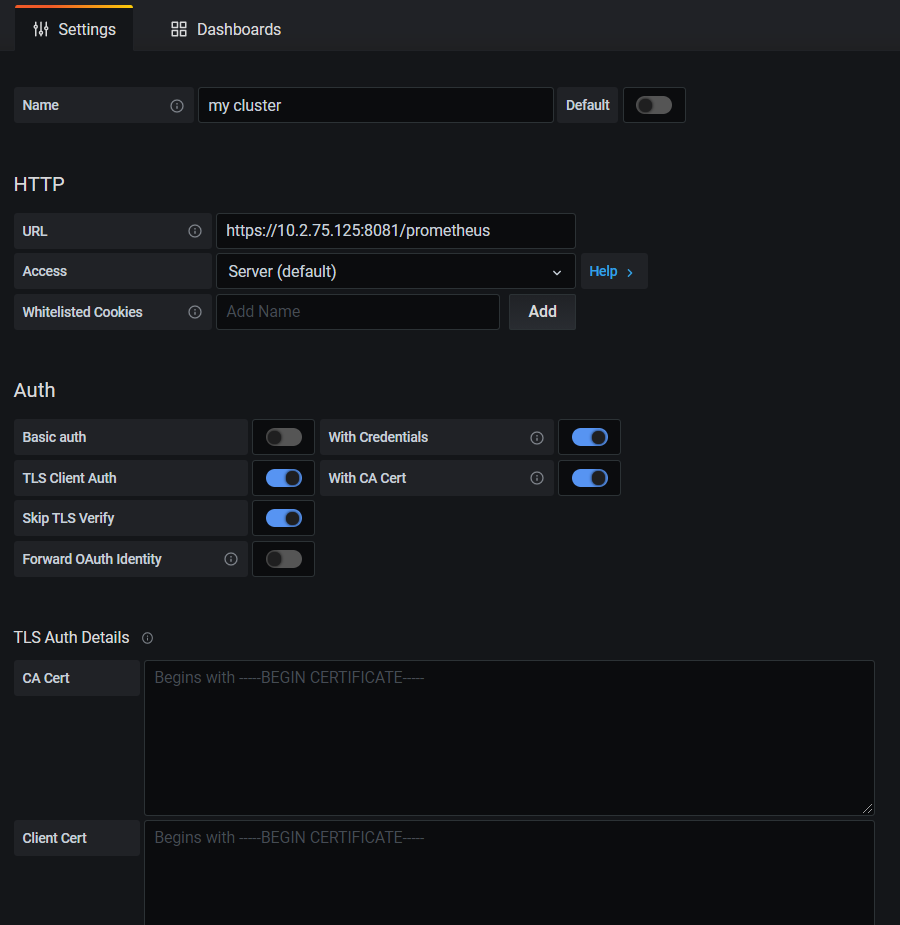
Now copy & paste the CA certificates (i.e. 2 certificates), the client certificate and the private key that we created in the previous section, into the correct text boxes in the form. Make sure that the data is pasted correctly.

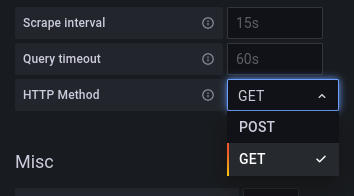
Please change the HTTP Method to GET. Failure to make this change may result in “Not Implemented” errors.
Lastly, press the Save & Test button on the bottom. You should see the following result:

If the data source was not added correctly, check the /var/log/grafana/grafana.log file for indications on what may be wrong.
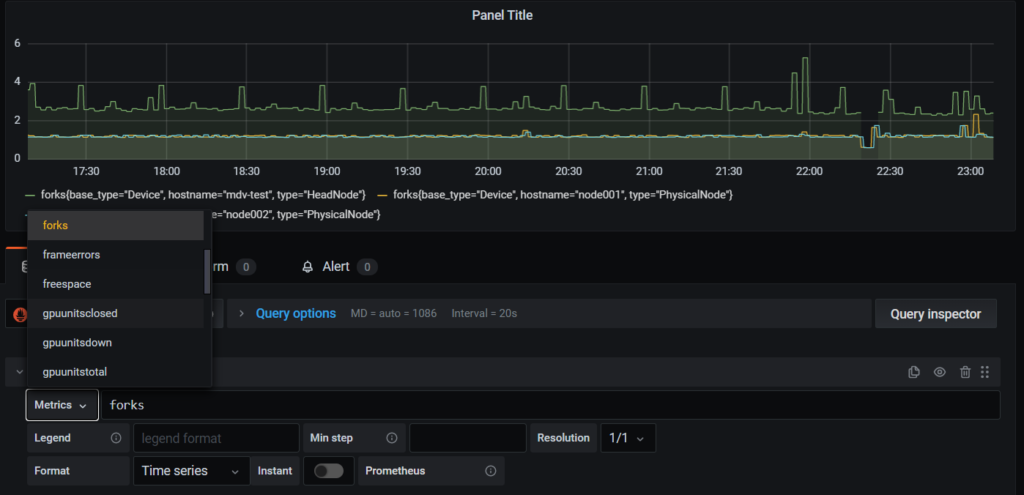
Creating a dashboard
After you have added your Bright cluster as a data source, you will be able to use monitoring data from your Bright cluster in the dashboards that you define in Grafana. Make sure you select your Bright cluster as a data source.
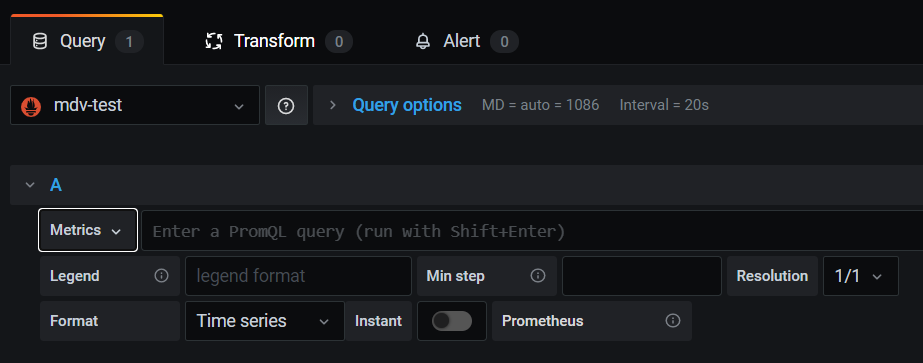
You will be able to browse the list of available metrics by selecting the Metrics drop-down control in the screenshot above.