This article is being updated. Please be aware the content herein, not limited to version numbers and slight syntax changes, may not match the output from the most recent versions of Bright. This notation will be removed when the content has been updated.
Setup Grafana with Bright 8.1
With this KB article we are going to setup Grafana on a Bright cluster, in order to consume metrics from cmdaemon.
Note: this procedure requires the Workload Accounting & Reporting (WAR) addon for the Bright cluster.
Download Grafana
We are going to use Grafana 4.6.0, but using a newer version should also work the same way.
On the head node, open a terminal as root user:
cd /root
wget https://s3-us-west-2.amazonaws.com/grafana-releases/release/grafana-4.6.0.linux-x64.tar.gz
mkdir -p /cm/local/apps/grafana
cd /cm/local/apps/grafana
tar xf /root/grafana-4.6.0.linux-x64.tar.gz
mv grafana-4.6.0 4.6.0
ln -s 4.6.0 current
adduser grafana
mkdir current/data
chown grafana:grafana data
Then setup a systemd service file in this path /etc/systemd/system/grafana.service:
[Unit]
Description=Grafana
After=network.target
[Service]
Type=simple
WorkingDirectory=/cm/local/apps/grafana/current
User=grafana
ExecStart=/cm/local/apps/grafana/current/bin/grafana-server
Restart=on-failure
[Install]
WantedBy=multi-user.target
and reload the systemd configuration:
systemctl daemon-reload
Then add this line to the shorewall configuration, to allow external access to
the Grafana dashboard /etc/shorewall/rules:
ACCEPT net fw tcp 3000 # Grafana
and reload the firewall configuration:
systemctl reload shorewall
Add the service to cmdeaemon
For this we use the Generic role functionality of cmdaemon, allowing to manage
grafana like all the other builtin services through Bright View and cmsh. From a
cmsh console:
[mb-cluster]% device use master
[mb-cluster->device[mb-cluster]]% roles
[mb-cluster->device[mb-cluster]->roles]% assign generic::grafana
[mb-cluster->device*[mb-cluster*]->roles*[Generic::grafana*]]% set services grafana
[mb-cluster->device*[mb-cluster*]->roles*[Generic::grafana*]]% set excludelist /cm/local/apps/grafana/current/data
[mb-cluster->device*[mb-cluster*]->roles*[Generic::grafana*]]% commit
Configure Grafana
You’ll be able to access Grafana with your browser, by going to
http://head-node-ip:3000, with default login username: “admin”, password:
“admin”.
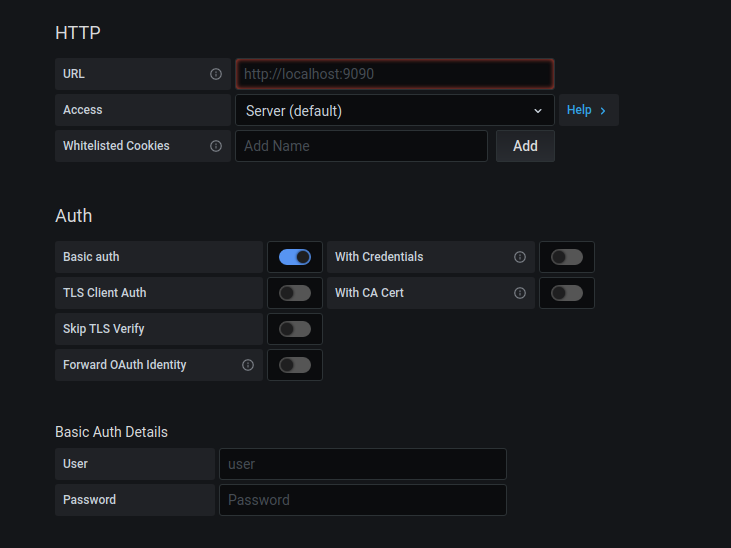
Add a new data source in the Grafana interface, with the following parameters:
- Name: cmdaemon
- Type: prometheus
- HTTP settings:
- URL: https://localhost:8081/prometheus
- Access: proxy
- HTTP Auth:
- Basic Auth: yes
- Skip TLS verification: yes
- Basic Auth details:
- User: <your username>
- Password: <your password>
In the authentication you should use your login. Make sure that you have the right permissions to be able to access the monitoring data from cmdemon.
After this is done, you’ll be able to create a dashboard in Grafana and use the cmdaemon data source. You can use PromQL queries in your graphs. Grafana autocompletion works and can guide you through the various metrics available.

